使用Grok製作一份台灣ETF的bar chart race
最近想透過Grok來製作這份台灣ETF的bar chart race,我把我的想法告訴給AI,他回給我了最陽春的程式碼:
https://www.instagram.com/reel/DHoFx0bTD5f
import yfinance as yf
import pandas as pd
from datetime import datetime
import numpy as np
# 步驟1:收集使用者輸入
def get_user_input():
stock_codes = []
while True:
code = input("請輸入股票代碼(輸入 'done' 結束):")
if code.lower() == 'done':
break
stock_codes.append(code + '.TW') # 自動加上 .TW 後綴,適用於台股
invest_day = int(input("請輸入每月定期定額的日期(1-31):"))
while True:
start_date_input = input("請輸入開始定期定額的日期(格式:YYYY-MM-DD,例如 2020-01-01):")
try:
start_date = pd.to_datetime(start_date_input).tz_localize('UTC')
break
except ValueError:
print("日期格式錯誤,請重新輸入(例如 2020-01-01)。")
while True:
try:
monthly_investment = float(input("請輸入每次定期定額的金額(例如 1000):"))
if monthly_investment <= 0:
print("金額必須大於 0,請重新輸入。")
continue
break
except ValueError:
print("輸入無效,請輸入一個數字。")
print(f"\n你選擇的股票代碼:{stock_codes}")
print(f"每月定期定額日期:{invest_day}號")
print(f"開始日期:{start_date.strftime('%Y-%m-%d')}")
print(f"每次定期定額金額:{monthly_investment} 元")
return stock_codes, invest_day, start_date, monthly_investment
# 步驟2 & 3:收集數據並計算定期定額(含股息再投入)
def process_data(stock_codes, invest_day, start_date, monthly_investment):
end_date = pd.to_datetime(datetime.today().strftime('%Y-%m-%d')).tz_localize('UTC')
# 獲取所有股票的歷史數據(包括股息)並提取名稱
data = {}
dividends_data = {}
stock_names = {} # 儲存股票名稱
for code in stock_codes:
stock = yf.Ticker(code)
df = stock.history(start=start_date.strftime('%Y-%m-%d'), end=end_date.strftime('%Y-%m-%d'))
if df.empty:
print(f"警告:無法獲取 {code} 的數據,請檢查股票代碼或網路連線。")
continue
df.index = df.index.tz_convert('UTC') # 統一轉換為 UTC 時區
dataundefined = df['Close']
dividends_dataundefined = df['Dividends']
# 提取股票名稱
try:
stock_info = stock.info
stock_names[code.split('.')[0]] = stock_info.get('longName', stock_info.get('shortName', '未知名稱'))
except Exception as e:
print(f"警告:無法獲取 {code} 的名稱,錯誤:{e}")
stock_names[code.split('.')[0]] = '未知名稱'
if not data:
raise ValueError("所有股票數據均無法獲取,請檢查輸入的股票代碼或網路連線。")
# 獲取所有唯一的交易日
all_trading_days = pd.concat([df.index.to_series() for df in data.values()]).unique()
all_trading_days = pd.DatetimeIndex(all_trading_days).sort_values()
print(f"交易日數量:{len(all_trading_days)}")
# 生成每月的定期定額日期
invest_dates = []
current_date = start_date.replace(day=1) # 從開始月份的第一天開始
while current_date <= end_date:
try:
invest_date = pd.Timestamp(year=current_date.year, month=current_date.month, day=invest_day, tz='UTC')
except ValueError:
current_date += pd.DateOffset(months=1)
continue
if invest_date in all_trading_days:
invest_dates.append(invest_date)
else:
next_trading_day_idx = np.searchsorted(all_trading_days, invest_date, side='right')
if next_trading_day_idx < len(all_trading_days):
next_trading_day = all_trading_days[next_trading_day_idx]
if next_trading_day <= end_date:
invest_dates.append(next_trading_day)
current_date += pd.DateOffset(months=1)
invest_dates = pd.to_datetime(invest_dates).unique()
print(f"生成的定期定額日期數量:{len(invest_dates)}")
if len(invest_dates) == 0:
raise ValueError("無法生成有效的定期定額日期,請檢查日期範圍或交易日數據。")
# 計算每檔股票的累積價值(含股息再投入)
cumulative_values = pd.DataFrame(index=invest_dates)
for code in stock_codes:
if code not in data:
continue
prices = dataundefined[dataundefined.index.isin(invest_dates)]
dividends = dividends_dataundefined[dividends_dataundefined.index.isin(invest_dates)]
units = 0 # 持有單位數
values = []
for date in invest_dates:
price = prices.get(date)
dividend = dividends.get(date, 0) # 若無股息,預設為 0
if pd.notna(price):
# 計算當天股息金額(持有單位數 × 每單位股息)
dividend_amount = units * dividend if dividend > 0 else 0
# 總投入金額 = 使用者輸入的固定金額 + 股息再投入
total_investment = monthly_investment + dividend_amount
# 購買單位數
units += total_investment / price
# 當前總價值
total_value = units * price
values.append(total_value)
else:
values.append(None)
cumulative_values[code.split('.')[0]] = values
# 將累積價值取整到個位數
cumulative_values = cumulative_values.round(0).astype(int)
# 添加總投入成本(使用者輸入的金額 × 投資次數)
total_investments = len(invest_dates) # 總投資次數
total_cost = total_investments * monthly_investment
cumulative_values.loc['總投入成本'] = total_cost
# 格式化日期索引
cumulative_values.index = cumulative_values.index.map(lambda x: x.strftime('%Y-%m-%d') if isinstance(x, pd.Timestamp) else x)
return cumulative_values, stock_names
主程式
def main():
stock_codes, invest_day, start_date, monthly_investment = get_user_input()
cumulative_values, stock_names = process_data(stock_codes, invest_day, start_date, monthly_investment)
output_file = 'etf_cumulative_values.csv'
cumulative_values.to_csv(output_file)
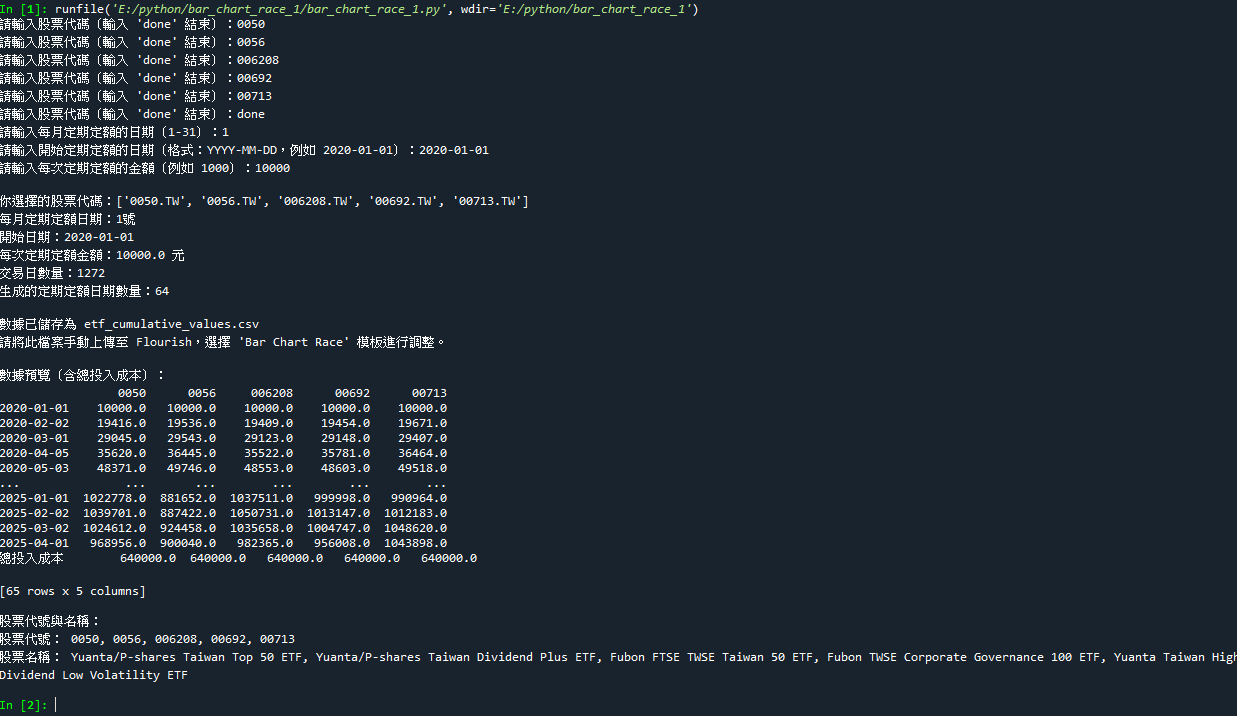
print(f"\n數據已儲存為 {output_file}")
print("請將此檔案手動上傳至 Flourish,選擇 'Bar Chart Race' 模板進行調整。")
print("\n數據預覽(含總投入成本):")
print(cumulative_values)
print("\n股票代號與名稱:")
print("股票代號:", ", ".join(stock_names.keys()))
print("股票名稱:", ", ".join(stock_names.values()))
這個程式主要功能有:
1.可以輸入很多ETF代碼
2.每個月幾號做定期定額
3.定期定額開始日
4.每次投入的金額
然後,會自動股息再投入(當天)
最終結果會產生CSV檔,如下:
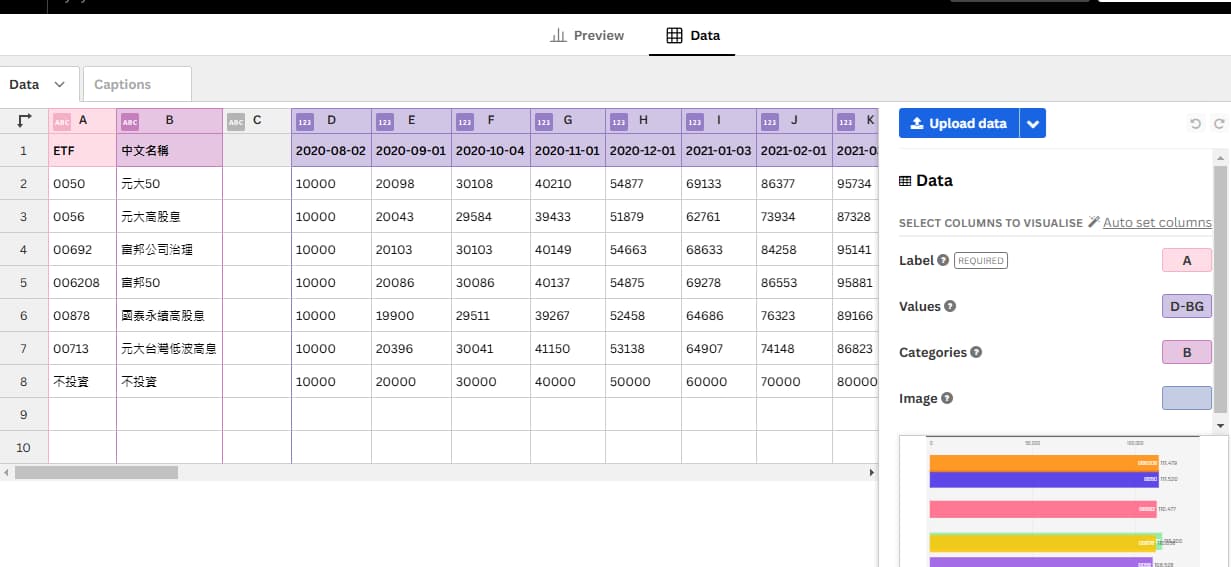
我只需要把這個CSV檔,匯入到專門做這種bar chart race 的網站Flourish去做就可以了。
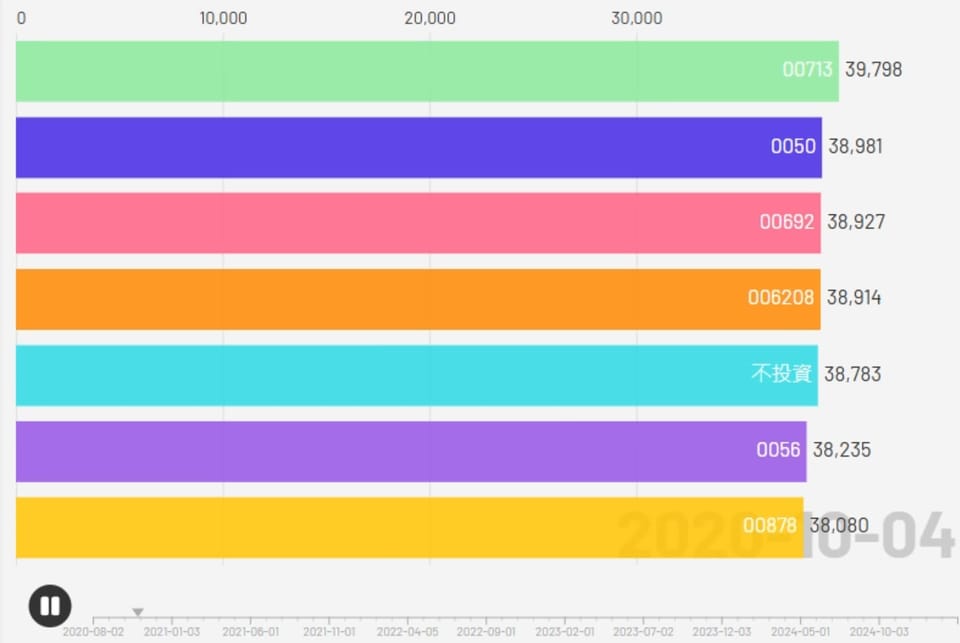
在Flourish簡單的設定行列代表的名稱,例如Lable標籤是代號、Value是月份對應的現在的資產;Categories分類就填中文名稱。
簡單的設定好之後,就會有競賽圖出現囉。
做這可以幹嘛?
我想可以給投資新手看如果簡單的定期定額,例如我做的是每個月無腦投10000,從2020年8月投資到現在,如果不投資放銀行就只有56萬,但是丟到0050卻可以有85萬的價值,直接多出51%的價值!更何況時下跌時加碼投資後,績效會更佳。
簡單來說就是圖示化投資績效,讓投資者更了解定期定額的魅力。
不過這個程式碼有個小問題,就是沒辦法做到配股,我嘗試試了幾回AI,到最後股數會莫名其妙翻倍,所以,如果拿來做銀行股,或其他有配股的公司計算定期定額,可能會稍微不準。
供給讀者們參考~